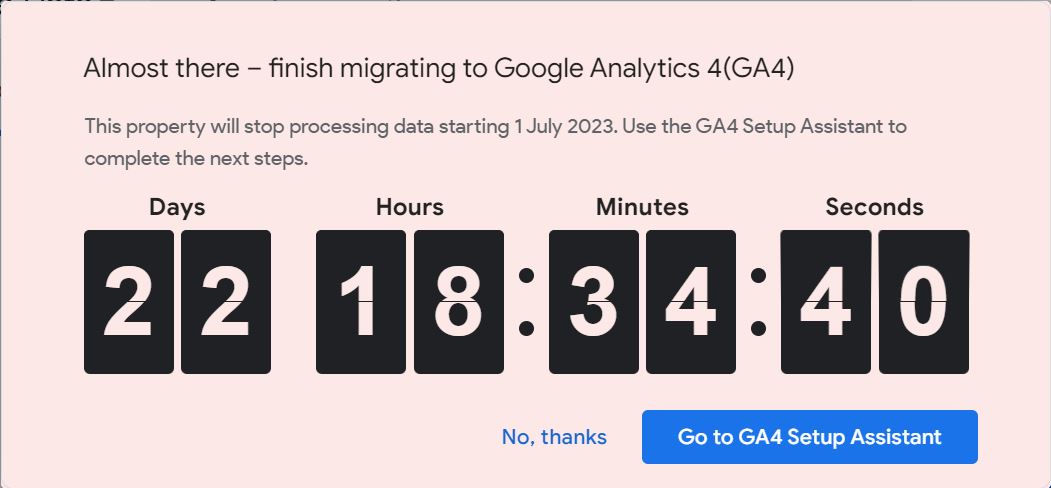
If you recognise this countdown clock, you’re probably familiar with the feelings it evokes. Fear, confusion, dread, panic… We feel a healthy mix of all four. Nevertheless, the communications and marketing team is arming itself for the switch from Universal Analytics (UA) to Google Analytics 4 (GA4). Our prep started with understanding the differences between UA and GA4.
Here are some differences between UA and GA4 that we believe are very relevant:
1. Session-based model vs event-based model
UA uses a session-based model and tracks data as sessions. A session is the timeframe between a user arriving on your website and leaving your website. For example, a user visits your homepage, views the “Upcoming events” page, clicks on “Book event” and leaves your page. UA will group all these actions under one session associated with that user.
GA4 will track each of these actions separately. This is because GA4 uses an events-based model. It focuses on tracking individual user interactions and specific actions. Each action is recorded as a separate event in GA4. This means you will be able to track and analyse each of these actions independently. -insert excited squeal-
2. Pre-defined reports vs highly customisable reports
UA has a range of predefined reports to choose from. They cover metrics like “acquisition overview,” “active users” and “page titles.” Audience insights are limited to these predefined reports and some customised reports.
GA4 does have a few predefined reports, but the real star is its highly customisable reporting platform. GA4 helps you to gain in-depth insights into user behaviour and engagement. It allows users to generate customised reports based on specific metrics, dimensions and filters. You can tailor reports to particular marketing goals. For example, you can create a report that includes form submissions and traffic from a specific source. We recommend you set your key performance indicators (KPIs) first, and then build the reports based on your KPIs.
3. Bounce rate and engaged users
Bounce rate is the percentage of visitors who leave a website or app without engaging with any of the content. According to UA, bounce rate = (single-page session/total sessions)* 100. Ugh, in English please! Okay here is an example - out of 100 visitors to your site, if 30 users land on the site and leave without engaging, the bounce rate for your website will be 30%. But that 30% will include users who did not engage (click, download, etc.) with the site, but stayed on and read the page content. This gives you misleading information about user behaviour.
In GA4, bounce rate = (bounce sessions/total sessions) * 100. The bounce rate calculation is based on engaged sessions and not single-page sessions. An engaged session is when a user performs an action like click, download, submit form, etc. If a session has at least one engagement, it is considered a non-bounce session. So the “bounce sessions” in the formula above is accurate. GA4 also lets users customise how to define engaged users. For example, you can set your engaged users as anyone who focuses their attention on the page for 15 seconds. Enough bouncing for the day, let’s move on.
4. Time on site
UA uses timestamps to calculate “time on site.” It determines “time on site” as the time between a user’s first hit and last hit during a session. (A hit is an interaction like a click, download, share.) It assumes that the user spent the entire duration between hits on your website. For example, if a user visits a website at 9.00 am and clicks on another page within the website at 9.05 am, the time on site is calculated as 5 minutes. If the user spends ten minutes reading the second page and leaves without any hits, there is no time stamp.
GA4 measures “time on site” as the duration between user interactions and events. GA4 tracks individual actions separately, so the time on site is based on actual user interactions. You get an accurate sense of how long your user spent on your website or app. You can also track what your user did during that time.
5. Data privacy and user consent
Compared to UA, GA4 is more assertive about data privacy and consent management. GA4 has features like data deletion and user ID reset that give users more control over their data. Users can request to have their data deleted and opt-out of data tracking. GA4’s event-based model lets you track only those events that you like, so you can control the data that’s collected. GA4 also lets you choose how long you want to retain data.
As impressive as the features are, it is important to note that data privacy compliance is the responsibility of the website owners. Make sure your website’s cookie and data privacy information and notifications are set up accordingly.
A note on user consent:
Both UA and GA4 need users to opt-in to a consent management system. The steps for you to configure the consent preferences for your specific GA4 property might be different from how it is in UA. Please make sure to familiarise yourself with the changes.
6. Setting up
The GA4 platform offers endless options to design and modify reports. This is great, but it can get overwhelming at the start. Before you set up GA4, it’s crucial that you determine what you need from your analytics. Think of what you need, and not what is possible.
If you are not sure or confident, we suggest you consider using an agency to set up GA4.
We hope this has given you a basic idea of what to expect from GA4. Let us know what else you’d like us to talk about. We’re here to keep your countdown clock nightmares at bay.
Leave a comment